Use investor activity data to find the hottest areas to invest and reverse engineer the process to find amazing deals using our deal finding technology.
Step 1: Find the hottest markets

Click the button at the top of the screen to find investor activity. These are areas that have the most investors doing profitable deals. These areas are where your best comparables are at to prove after repair value.
Step 2: Identify the hotspots and drill down

The investor activity is displayed on the map. What loads on the map will be all of the properties that have sold in the last 12 months that have been flipped at 75% or better of ARV. The larger the circle and the higher the number, the more deals that were done in that area. You will notice that there are usually clusters or higher concentrations of these properties (circled in red in the above). Congrats! You’ve just uncovered regions of high investor activity, the areas you should target in your investment search.

Step 3: Circle the area using our drawing tool to isolate the area so you can see the individual deals. They appear as red icons on the map.

Click one of the property matches on the left to open the Live Comparative Market Analysis and research what an "actual" deal looks like in your target market. Select the tab from the navigation that says "Before and After" to see all the data and photos about that deal.

You can learn what a deal looks like by looking at the before and after section. Why look retroactively? If a market in its current status is a painting, all of the properties sold are the brush strokes that make up that painting. Simply put, there is a ton to learn by looking historically! You can learn what’s working, and what’s not, and dig into each of the sold properties on the map to learn specifics. If you click on individual properties, you can learn things like what rehab has been done from the Before & After photos, how long properties are under construction, Days on the Market (DOM), price decreases/increases of listings, and a ton of other valuable information.
Step 4: Filter for Active Deals

Click the Green button that says "Find - Click to find Similar Active Deals". Privy will pull comps on every Active property in that area and show you only the one's that we flag as great deals.

As you can see, Privy found this property on Lasalle St. that is for sale and just came on the market. You know the seller is motivated and you know exactly what they will sell you the property for. Click the property card to see the full comparative market analysis for the house to analyze it for potential profit.
Step 5: Scroll down to the Comparables section to see what other properties have sold for and see investor activity of properties that were flipped.

As you can see, there are several fix and flip comparables in the area. They are the ones with the before price and the after price below.

Step 6: Save the Search to get email alerts
If you've followed Steps 1-5 successfully, you’ll be looking at the active listings for single-family properties that you could buy today for 70% or better of the ARV (as supported by real and accurate comparables) that are in a high investor activity area within your target market.
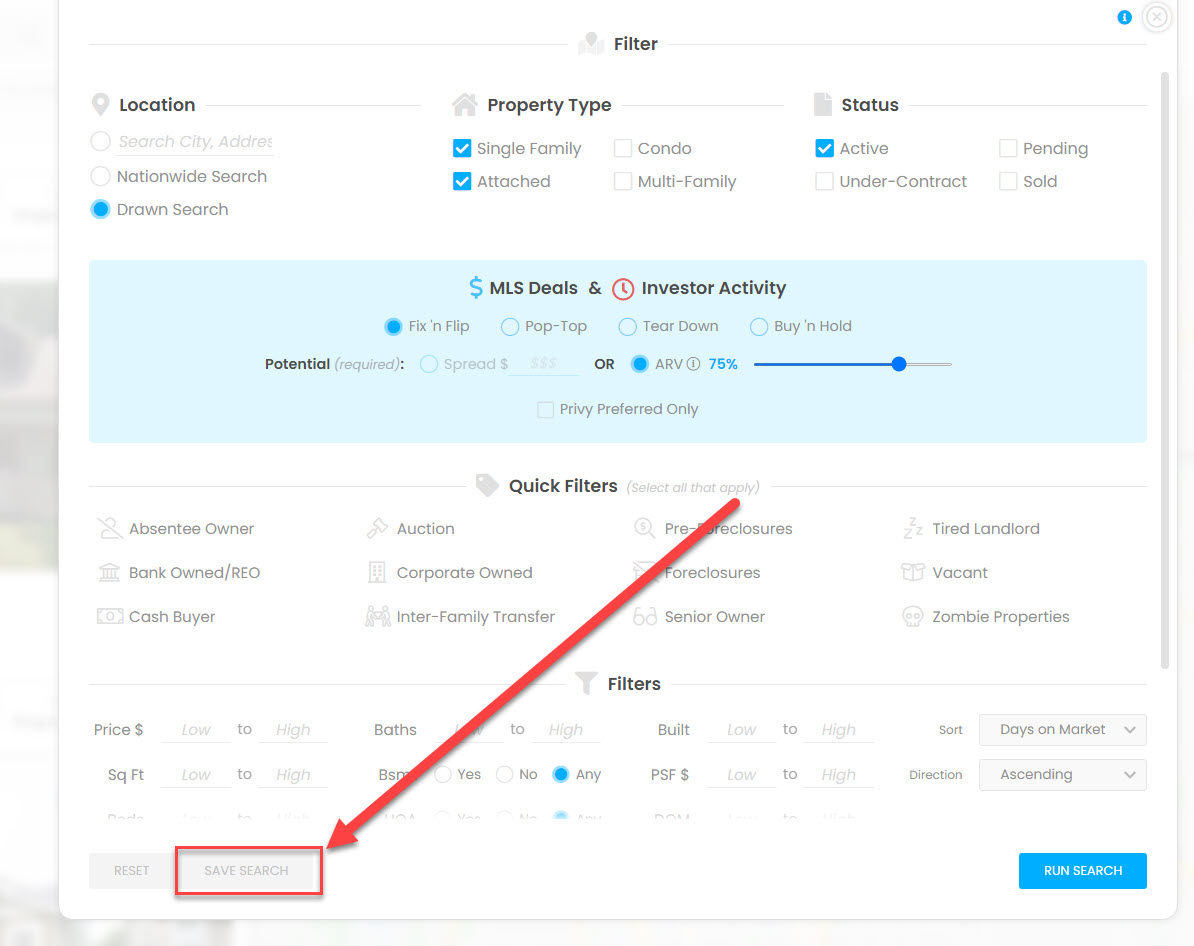
The final and most important step...Save this search. Click the "Filter" button.

Click "save" from the bottom left hand corner of the filter. Choose a name and email frequency, and you're done! Just check your email for deal alerts and you'll find highly profitable deals in your inbox almost daily!

Here's the video of us finding this deal live!
